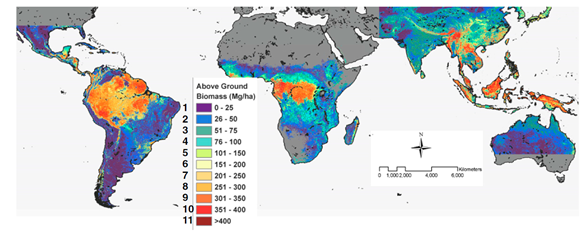
Figure 1 below is a map of the above ground biomass. Which is defined by the IPCC (2006) as all living biomass above the soil including stems, stumps, branches, leaves, bark, and seeds.
 |
| Figure 1 |
Figure 2 below shows the total carbon biomass (so this is the above ground biomass plus below ground biomass which is the roots) and, most importantly in my opinion, the uncertainty in these estimates. Why the uncertainty? Due to errors with estimating spatial distribution of above ground biomass from Lidar canopy height measurements, errors with estimating below ground biomass from above ground biomass, a 1km resolution might not fully capture the spatial variability in above ground biomass, and errors associated with the satellite imagery used (Saatchi et al., 2010). The supporting information accessible through their paper as 'Fig. S3' gives a good detailed breakdown.
 |
| Figure 2 |
We can see that these regions hold a lot of carbon! And that’s without us including the carbon in the soil as soil organic carbon! If we break this carbon storage down across the regions South America potentially stores a whopping 49% of the total stock for these regions (Saatchi et al., 2010). So how is changing land use for agriculture going affecting the carbon in these forests....
Well, Conti et al., (2014) undertook a study to assess carbon storage under different land uses using biomass models* and it is an excellent example of why the above statement is really not the case! I chose this study by Conti et al., (2014) as they looked at the Chaco Forest, which is a subtropical seasonally dry forest, in South America which ties in with our carbon findings and agricultural expansion predications so far. It is also experiencing some of the highest deforestation rates for agriculture crops in the world (Conti et al., 2014).
*where you use allometic models / species specific equations to estimate biomass, then combine accordingly across a plot to obtain total biomass per hectare.
This is what they found:
 |
| Plant and soil carbon pools in the different ecosystem types. |
As we can see in the graphs, above ground biomass is significantly higher in primary forest, secondary forest, closed shrub-land and open-shrubland compared to potato crops. And the same pattern is observed for above ground dead biomass of which a potato crop has none. Looking at the amounts of organic carbon and inorganic carbon (which is the carbonate content) in the soil, we have to look at the individual layers: for the surface (0-10cm) and subsurface (10-30cm) soil layers, soil organic carbon is much higher in primary and secondary forest soils than potato crop soils. Analysing the soil inorganic carbon the authors found soils undergoing potato cultivation had the lowest amount of inorganic carbon.
Already we can see a difference in the carbon
sequestration between forests and crops. Combining these results and looking at
total organic amount of carbon each ecosystem has:
Aggghh - so what do we do?!?!! We need to store the carbon, but we need to eat, but we are putting loads more carbon into the atmosphere, but we can’t say to developing regions: no you can’t have any more land for food stop what you are doing now.
Well that is what we will tackle in the next post: Carbon or food? What to choose.......

I believe that potatoes originate from Peru, where they grow around 4000 varieties (we only see a limited number of the most ‘appealing’ ones in the UK), and are grown in the harsh conditions of the Andes at altitudes over 3000 metres. This shows the kind of environment that potatoes can grow in – it doesn’t need to be the rich fertile land of forests! Unfortunately it seems the ease of production for large producers has long been more important than the global impact of destroying forests :(
ReplyDeleteI never knew that about potatoes, thanks for sharing =). And you are absolutely right it is the whole short-term gain that drives a lot of deforestation rathering than focusing on long-term sustainabilty.
Delete