Showing posts with label agricultural expansion. Show all posts

Monday, 23 November 2015

Part 1: Food or Carbon? What to Choose?

It has been far too long since my last full post! I can only apologise and offer meager excuses of tackling difficult data coursework and busy times at work! Should be seeing some more regular posts so please check back soon =) But let us not digress any further! 

SO with a rainy Saturday ahead, let's look at how we can tackle the whole 'how can countries increase their agricultural land without dramatically reducing carbon storage?' Obviously an ideal situation would be to stop agricultural expansion, however, this is unfeasible when intensification methods can only take us so far (and also impact upon our environment - to be explored in later posts!) and there is a demand for food and income. With environmental problems everywhere we turn; we have to find a solution that works in order to avoid land clearances like those happening in Indonesia.

This is where modelling can help us! One example that I wanted to share was the work done by Chaplin-Kramer et al., (2015): these guys modelled the impact on carbon storage of different agricultural expansion scenarios: 

1.  Edge: expansion from forest edge towards the core
2.  Core: expansion from the center of forest patches out towards the edges
3.  Fragmentation: expansion converts the forest pixel furthest from the forest edge in each time step
4. Current cropland: agriculture expands outwards into whatever is surrounding it. 

As we can see the scenarios are quite simplistic; in reality cropland expansion is not clearly subdivided into these categories and the authors make clear that their fragmentation scenario is extreme (fragmentation usually follows road expansion). But, as with all things you have to start somewhere, so with modelling we have to simplify the scenarios to a certain extent in order to quantify their individual impact. The scenarios the authors have chosen allow them to test the sensitivity to different spatial methods of expansion of a theoretical homogeneous, continuous patch of forest to see how their model is working and then assess the scenarios on study forests in Mato Grosso and Mato Grosso do Sul.

What did they deduce?  


If you have a single patch of continuous forest and we convert 30% of it, we can see that carbon stocks are highest for edge expansion, then core expansion, then dramatically lower for fragmentation; from these findings we can see that carbon stocks are more sensitive to fragmentation. 

Does this fit in with our wider knowledge? The answer to this is yes; it makes sense to see less carbon lost when deforesting from the edge of a forest due to there being less carbon there initially. We find less carbon there because of the environmental conditions at the edge of a forest; temperature, light, wind, and moisture are all different compared to the forest interior resulting in different species composition and smaller trees at the edges. Much research has been done concerning 'edge effects' and studies have found that when edges are created many trees die as the new conditions are beyond their physiological tolerances. 

BUT when interpreting Chaplin-Kramer et al. (2015) fragmentation results we must remember that the fragmentation scenario employed is not a realistic simulation, and instead is modelled to simulate the greatest amount of damage that can be done.

Now let’s see what happens to carbon stocks of Mato Grosso and Mato Grosso do Sul when these scenarios are modelled..... 

For Mato Grosso interestingly we can see that fragmentation and core expansion are pretty similar, though edge expansion is still better. BUT even better than that is expansion out from regions that are already used for agriculture into surrounding land: 

For Mato Grosso do Sul expansion from current cropland is again the better method, and intriguingly core expansions appears to be slightly worse than the fragmentation scenario:


Hmmmm intriguing results… the reason why we might be seeing core expansion having a greater impact than fragmentation in Mato Grosso do Sul, as well as core and fragmentation being almost the same for Mato Grosso is due to the already fragmented nature of the forests. This is corroborated by looking at the results when applied to the ‘continuous forest’: the fragmentation scenario has the greatest impact initially before levelling off. So the already fragmented nature of the forests perhaps negates the effect of the fragmentation simulation.... 

What are the limitations of this study? Two I have already mentioned and they are the categories of agricultural expansions and how fragmentation is simulated. Another is that the effects of land clearance on the remaining forest is not taken into account; edge effects penetrate into the forest. Additionally soil carbon is not considered; soil carbon is a major carbon store and disturbances caused by land clearance will impact upon this. 

Even with these limitations considered, what I think we can draw from this study is that by gradually spreading outwards from existing agricultural lands and minimizing the number of edges we create we can reduce carbon losses. Yes the more we expand the more carbon we lose, but if we combine gradual expansion outward from existing agricultural land combined with sensible agricultural intensification methods then we could protect our forests of carbon.

But the next hurdle - though we can identify the best expansion methods, how do we actually put this into practice and persuade farmers to follow certain expansion policies?  More on this in the next post!  


Thursday, 5 November 2015

Forests of Carbon or Fields of Food?

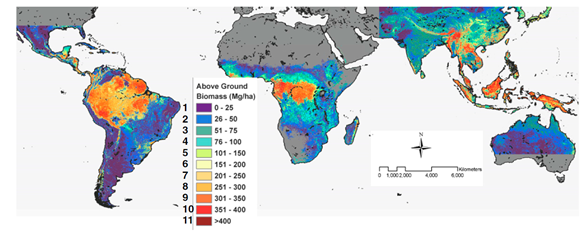
 As we saw from the last post deforestation for agriculture is most likely going to occur more in the tropical regions. So if we want to quantify the effects of deforestation in these regions on carbon we need comphrensive data on carbon stocks. This is what Saatchi et al., (2010) set out to do, and through the use of Lidar, tree allometry, and spatial modelling they created a benchmark map of carbon stocks for tropical regions for the year 2000.

Figure 1 below is a map of the above ground biomass. Which is defined by the IPCC (2006) as all living biomass above the soil including stems, stumps, branches, leaves, bark, and seeds.


Figure 1

Figure 2 below shows the total carbon biomass (so this is the above ground biomass plus below ground biomass which is the roots) and, most importantly in my opinion, the uncertainty in these estimates. Why the uncertainty? Due to errors with estimating spatial distribution of above ground biomass from Lidar canopy height measurements, errors with estimating below ground biomass from above ground biomass, a 1km resolution might not fully capture the spatial variability in above ground biomass, and errors associated with the satellite imagery used (Saatchi et al., 2010). The supporting information accessible through their paper as 'Fig. S3' gives a good detailed breakdown.

Figure 2

We can see that these regions hold a lot of carbon! And that’s without us including the carbon in the soil as soil organic carbon! If we break this carbon storage down across the regions South America potentially stores a whopping 49% of the total stock for these regions (Saatchi et al., 2010). So how is changing land use for agriculture going affecting the carbon in these forests....  
One argument is: "weeellll we are replacing forests with crops that also use CO2 for growth and hence also store carbon as biomass, as opposed to deforesting to graze animals or build houses; so it shouldn’t make too much of a difference in terms of carbon storage what plant is growing there".  

Well, Conti ­et al., (2014) undertook a study to assess carbon storage under different land uses using biomass models* and it is an excellent example of why the above statement is really not the case! I chose this study by Conti et al., (2014) as they looked at the Chaco Forest, which is a subtropical seasonally dry forest, in South America which ties in with our carbon findings and agricultural expansion predications so far. It is also experiencing some of the highest deforestation rates for agriculture crops in the world (Conti et al., 2014).

*where you use allometic models / species specific equations to estimate biomass, then combine accordingly across a plot to obtain total biomass per hectare.

This is what they found:
Plant and soil carbon pools in the different ecosystem types.  

As we can see in the graphs, above ground biomass is significantly higher in primary forest, secondary forest, closed shrub-land and open-shrubland compared to potato crops. And the same pattern is observed for above ground dead biomass of which a potato crop has none. Looking at the amounts of organic carbon and inorganic carbon (which is the carbonate content) in the soil, we have to look at the individual layers: for the surface (0-10cm) and subsurface (10-30cm) soil layers, soil organic carbon is much higher in primary and secondary forest soils than potato crop soils. Analysing the soil inorganic carbon the authors found soils undergoing potato cultivation had the lowest amount of inorganic carbon.

Already we can see a difference in the carbon sequestration between forests and crops. Combining these results and looking at total organic amount of carbon each ecosystem has:


.....we can see the carbon lost though turning a forest into cropland: which is 31.6%! (Conti ­et al., 2014).

By switching forests of carbon for fields of food in South America we are causing less carbon to be stored on earth and more in the atmosphere, which we know as CO2 will increase earth’s global temperature. Deforestation for agricultural land is one of the reasons we have been seeing an increase in the average net CO2 emissions from land to the atmosphere over the last 10 years (IPCC 2013).  

Aggghh - so what do we do?!?!! We need to store the carbon, but we need to eat, but we are putting loads more carbon into the atmosphere, but we can’t say to developing regions: no you can’t have any more land for food stop what you are doing now.

Well that is what we will tackle in the next post: Carbon or food? What to choose.......

Thursday, 29 October 2015

Forest Future


Credit: Alice Fitch. South Cardamoms

We left our ancestors in the last post just getting involved in agriculture - but let's fast forward to today. One of the major side effects of agricultural expansion is deforestation (Chaplin-Kramer et al., 2014). The global impacts of this deforestation relate to:
  • Carbon Storage
  • Loss of biodiversity
  • Hydrological changes
  • Habitat fragmentation

In today's world with all our intensification methods, we could question is agricultural expansion still occurring, namely, will we see more deforestation for agriculture?

This is where modelling can help us; Schmitz et al., (2006) compared the results of 10 agro-economic models —MAgPIE, GLOBIOM, GCAM, IMPACT, AIM, FARM, GTEM, ENVISAGE, MAGNET, EPPA — under a number of scenarios considering socioeconomic developments and climate change to assess how much land will be used for crops in 2050. Modelling inter-comparison is really important for attempting to 'predict' the future as each model reaches its conclusion in a different way; this happens as models differ in the number of land-use types they employ, what assumptions they apply, and what they consider the most important for determining crop allocation and expansion (Schmitz et al., 2006). Additionally, scenario modelling allowed us to handle uncertainty in changing climatic and economic conditions.  

Their findings: a global rise in the amount of land devoted to agriculture — possibly 200-300 million more hectares— with the greatest regional increases in sub-Saharan Africa and South America, and a general decrease in Europe (Schmitz et al., 2006).

Figure 1. The graph shows the development of cropland from 2005 to 2050, all data is normalized to HYDE model data for 2005. The boxplot shows the change in cropland under S1: no climate change, medium economic growth and population development. S2: no climate change, lower population growth in developed countries, higher in developing countries. S4 and S6: medium economic growth and population development with pessimistic climate change scenarios (Schmitz et al., 2006). 

 As we can see in figure 1, the underlying modelling processes meant models did differed in their results: FARM for instance predicts a global decrease, while IMPACT and GCAM show increases and decreases across the 50 years. 

However, it is important not to rely too much on the results as these land use models are all relying on data from the other models the authors used to model climate, hydrology, vegetation, crop growth, population growth etc. These models in themselves hold their own assumptions and difficulties, for instance with vegetation you have to take into account phenology, water requirements, amount of photosynthetic radiation, CO2, nutrient limitation etc. to be able to model growth. Scale this up globally and you can see where errors could creep in! 

BUT, after we have taken all this into account, what is interesting with the study is that across the extreme scenarios there is a trend towards global increases in cropland by some degree. SO I think we will see more agricultural expansion globally, occurring more in developing countries due to socioeconomic factors, and therefore more deforestation occurring as a result of land use change.

So, what will this do for our environment?

Let's find out in the next post! Forests of Carbon or Fields of Food......


Thursday, 22 October 2015

The Rise of Agriculture


Agriculture [noun]: the science or practice of farming, including cultivation of the soil for the growing of crops and the rearing of animals to provide food, wooland other products.
                                                                                                        (Oxford University Press 2015)


The main themes of my blog that I will use to explore to the effects of feeding us is how agriculture causes global environmental change through: 

                - the conversion of land 
                - the production methods used

First I thought to find out how agriculture started...

As we are delving back into time, key geological epochs to know about are the Pleistocene — which began roughly 2.58 million years ago (Gibbard and Head 2010) to roughly 11,700 years ago (Walker et al., 2009)  — and the Holocene which directly followed it. When exactly the Holocene finished (and the Anthropocene which we are in now began) is one of much debate, some interesting articles on the subject are available here and here. But for us the end of the Pleistocene and beginning of the Holocene are the most importance for agricultural origins.


From hunter-gatherers to agriculturists


Why we moved from hunter-gatherers to an agricultural society is intriguing, it is thought to be due to climatic change at the end of the Pleistocene. Through studying ice cores we can see the climate of the Pleistocene went through periods of abrupt warming and cooling (Cummings et al., 2006), and this unreliable climate is thought to have made agriculture pretty much impossible for our ancestors (Richardson et al., 2001). As the last ice age of the Pleistocene came to an end the earth entered a new epoch, the Holocene, which had a much warmer and more stable yearly climate. We can see this change in the ice cores as demonstrate in figure 1. below:
Figure 1: Graph showing isotope levels of oxygen from ice-cores, which reflect temperature changes. (Cummings et al., 2006)   
This new climate allowed agriculture to be a feasible long term option (Richardson et al., 2001), and using radiocarbon dating we can see that agriculture appeared during this time. Adapting to this changing climate, agriculture seems to have developed separately in about 9 locations (Diamond and Bellwood 2003) and then spread globally as, compared to hunting and gathering, agriculture could support larger populations. (Richardson et al., 2001, Diamond and Bellwood 2003):

Figure 2. Archeological map of agriculture homelands and spread of associated cultures, with approximate radiocarbon dates  (Diamond and Bellwood 2003). 


Exactly how those hunter-gatherers began agriculture appears to have been a fairly gradual process incorporating a combination social and technological factors (Cummings et al., 2006). Many groups already had an agricultural element to their societies from which they expanded upon and Roth (2006) provides interesting evidence for women driving the adoption of agriculture, and how it began as an extension of their 'gathering' role (girl power eh!). 

So that's how we became an agrarian society. I hope you found out something new and i''ll leave you here with this interesting tidbit:

Though agriculture dominates the globe hunter-gatherer societies still remain out there, one such example is the Sentinelese people living on North Sentinel Island in the Bay of Bengal. They are one of the last ‘un-contacted' tribes and have been able to remain this way for so long due to being incredibly hostile to any outsider contact. If you are interested in learning more about them click here.

Credit: North Sentinel Island 2015


Till next time!